Iterative Grid Network for Ignition Simulation
For eighteen years I watched fire behave like a physical system. IGNIS is that experience translated into a grid: cellular automata, data-oriented design, and the pressure of incident management. It is still in development — a working foundation for the public to feel the stakes, and eventually for agencies to train on something closer to the real machine.

Pocket Operations Commander
Step into the seat
The first screen is not a tutorial — it is a desk. Terrain under your eye, incidents burning on the map, weather and cost ticking on the right. Fleet Command waits for a staging point. You are already late, and that is the point.
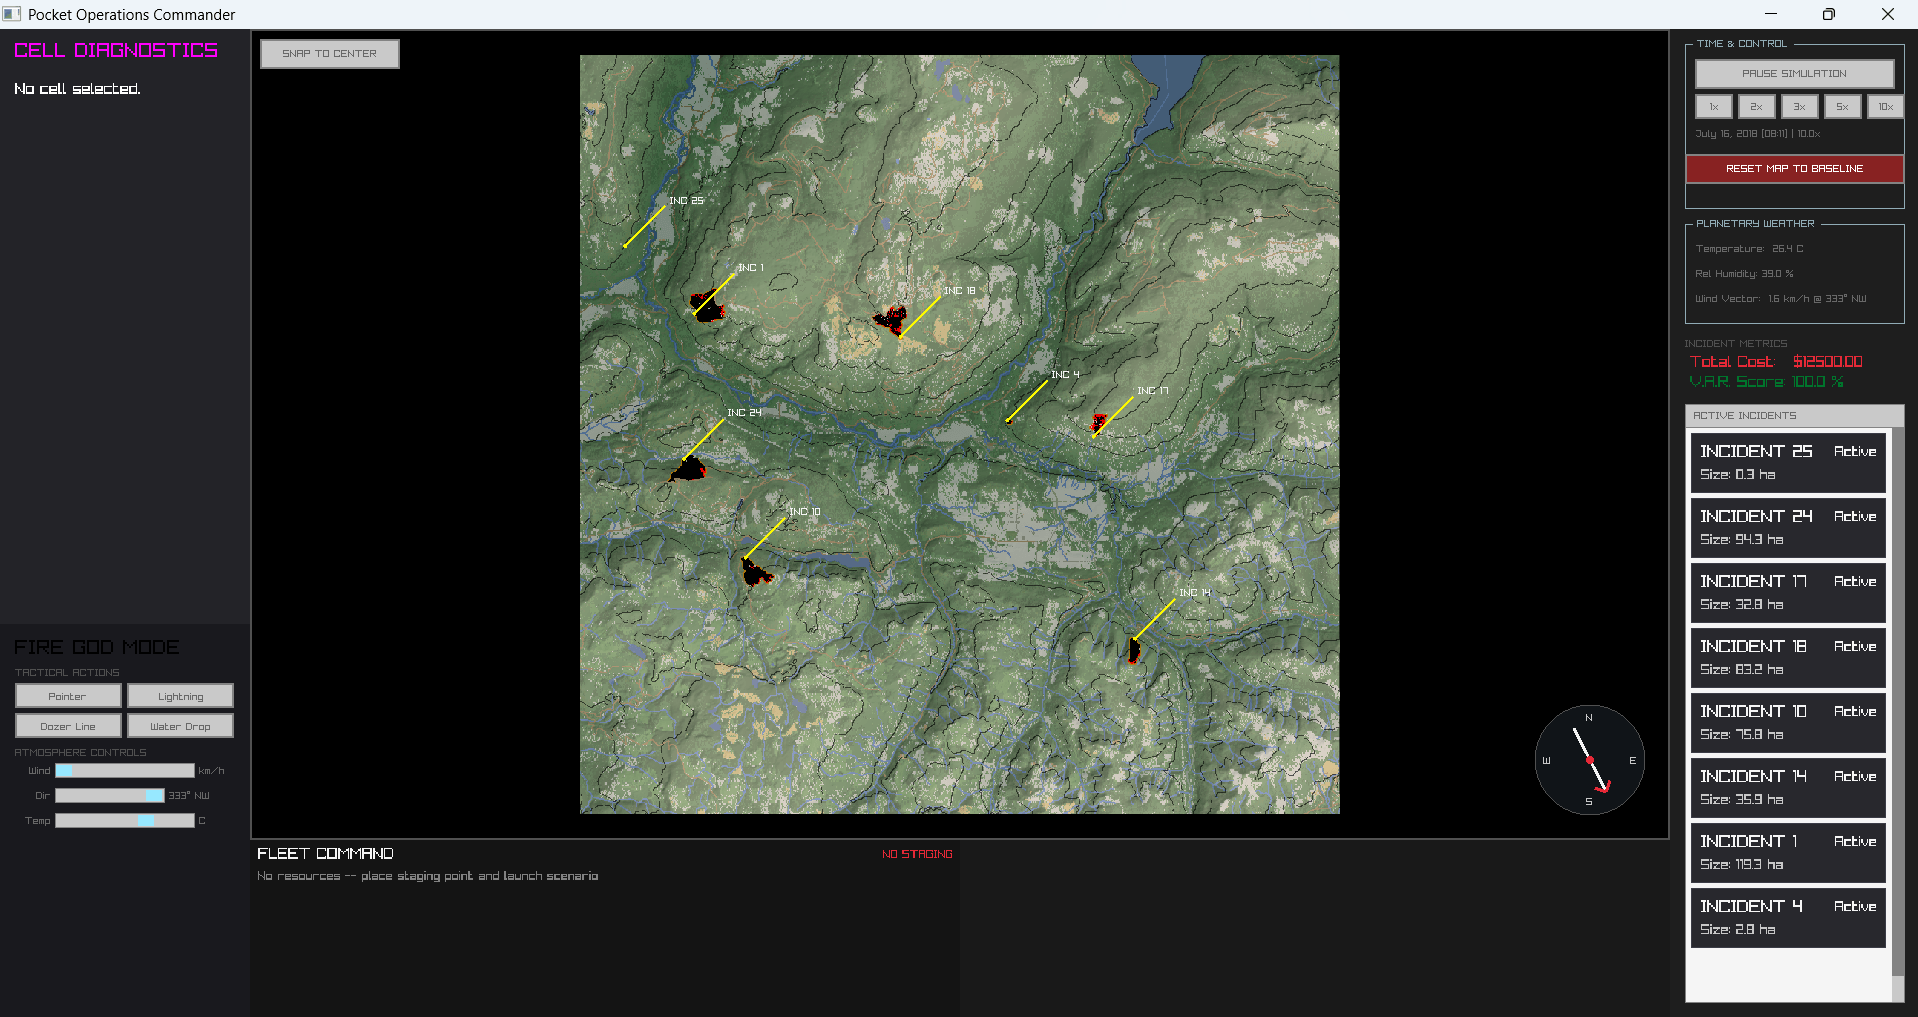
Chapter 01 · Pressure
Every hectare has a price
Active incidents stack as cards: size in hectares, status, a list that grows when you hesitate. Total cost climbs in red. V.A.R. score holds green until values at risk start to slip.
This is how emergency management actually feels — parallel fires, incomplete information, and a ledger that does not care about your intentions.
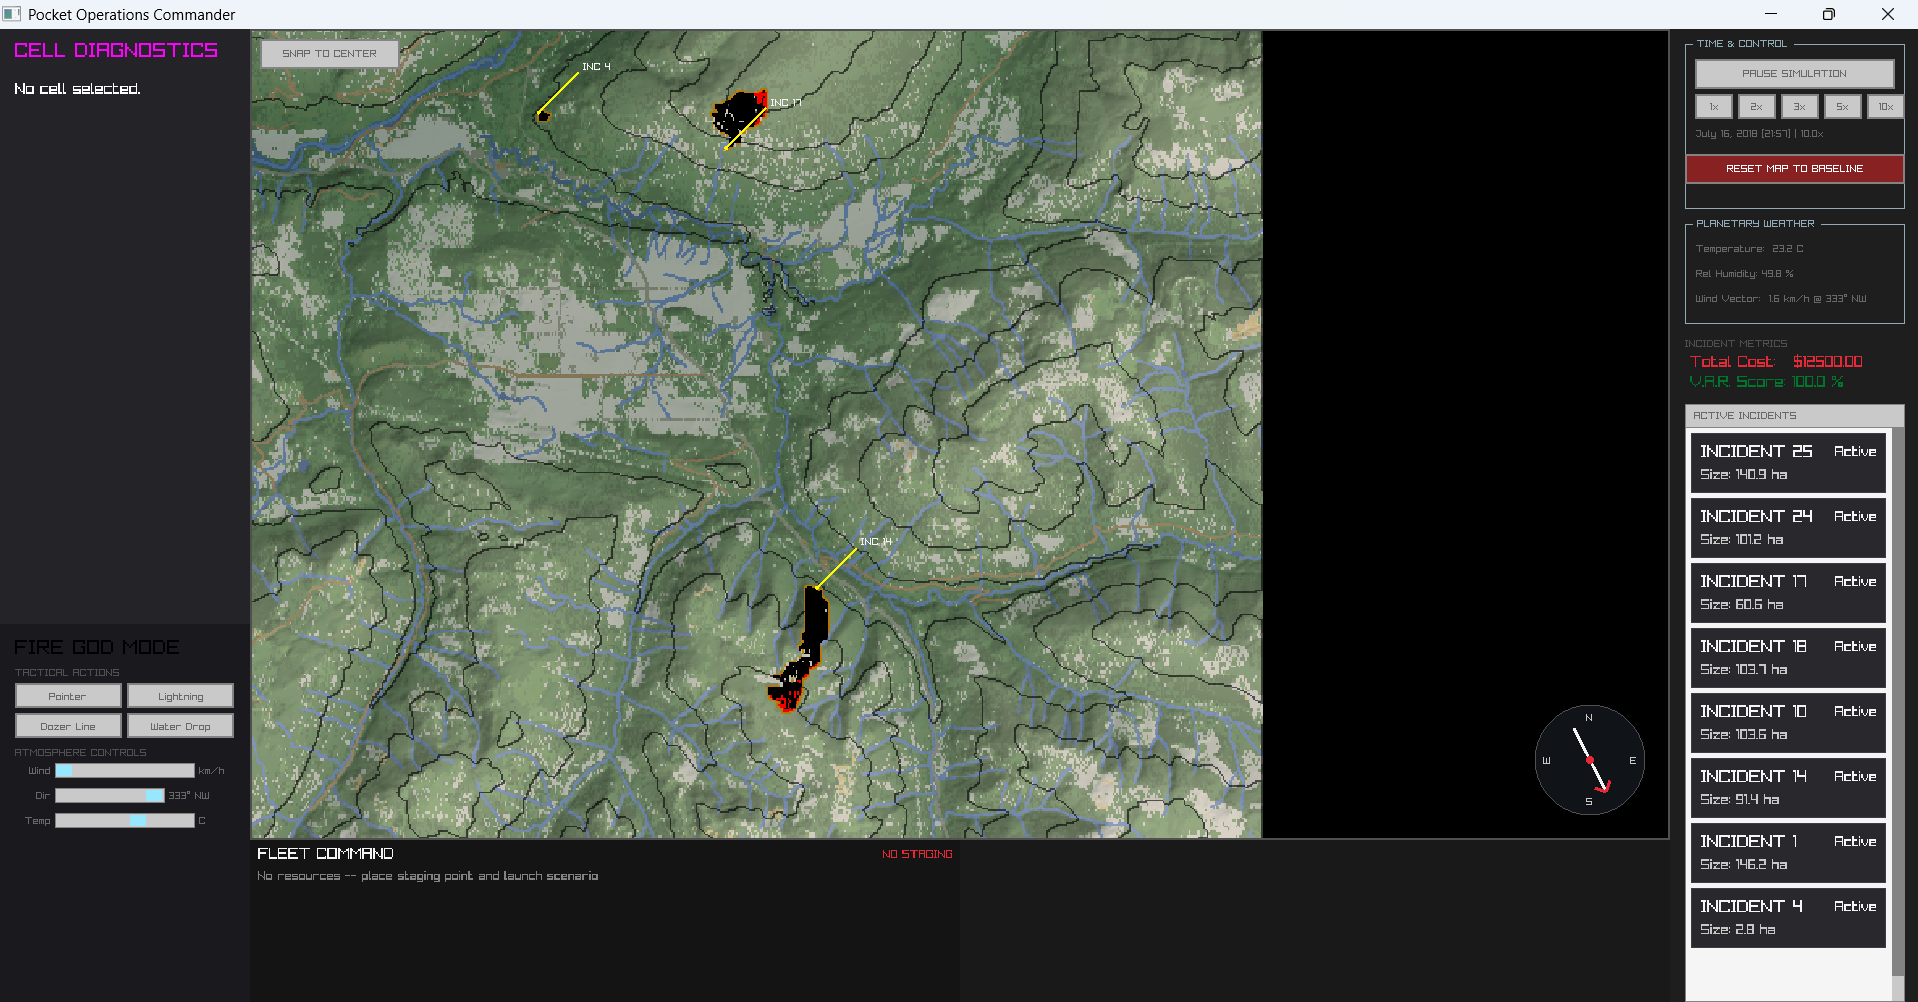
Chapter 02 · Atmosphere
Fire God Mode is not a toy
Lightning, dozer line, water drop — tactical verbs from the field. Wind, direction, and temperature are sliders because the atmosphere is a control surface, not a backdrop.
Cell diagnostics wait for a selection. The simulation will not invent meaning for you; you have to look at the grid.
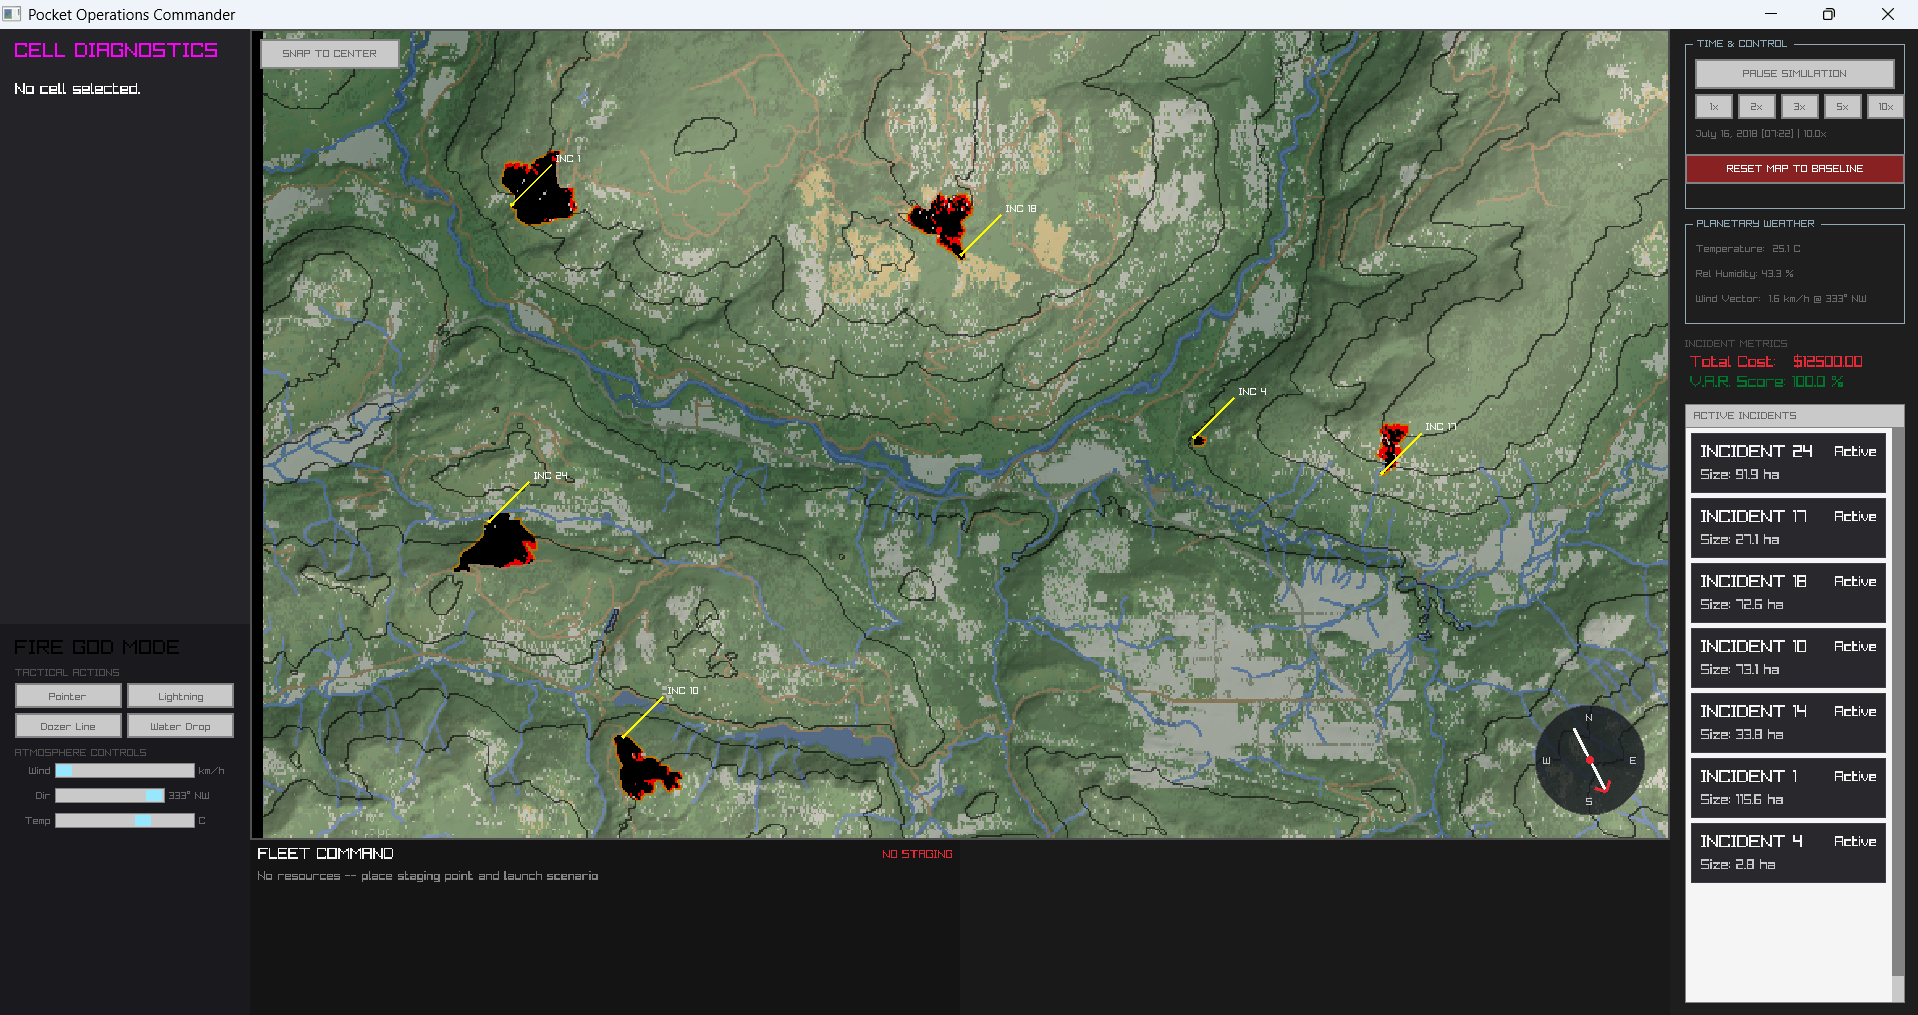
Chapter 03 · Time & terrain
Run the clock. Watch the ridge take fire.
Time scales from 1x to 10x because wildfire decisions are about latency as much as geography. Pause when you need a breath. Reset when the lesson is over.
Two burns on a ridge teach more than a slide deck: wind vectors, containment lines, and the moment a small ignition becomes an incident with a name.
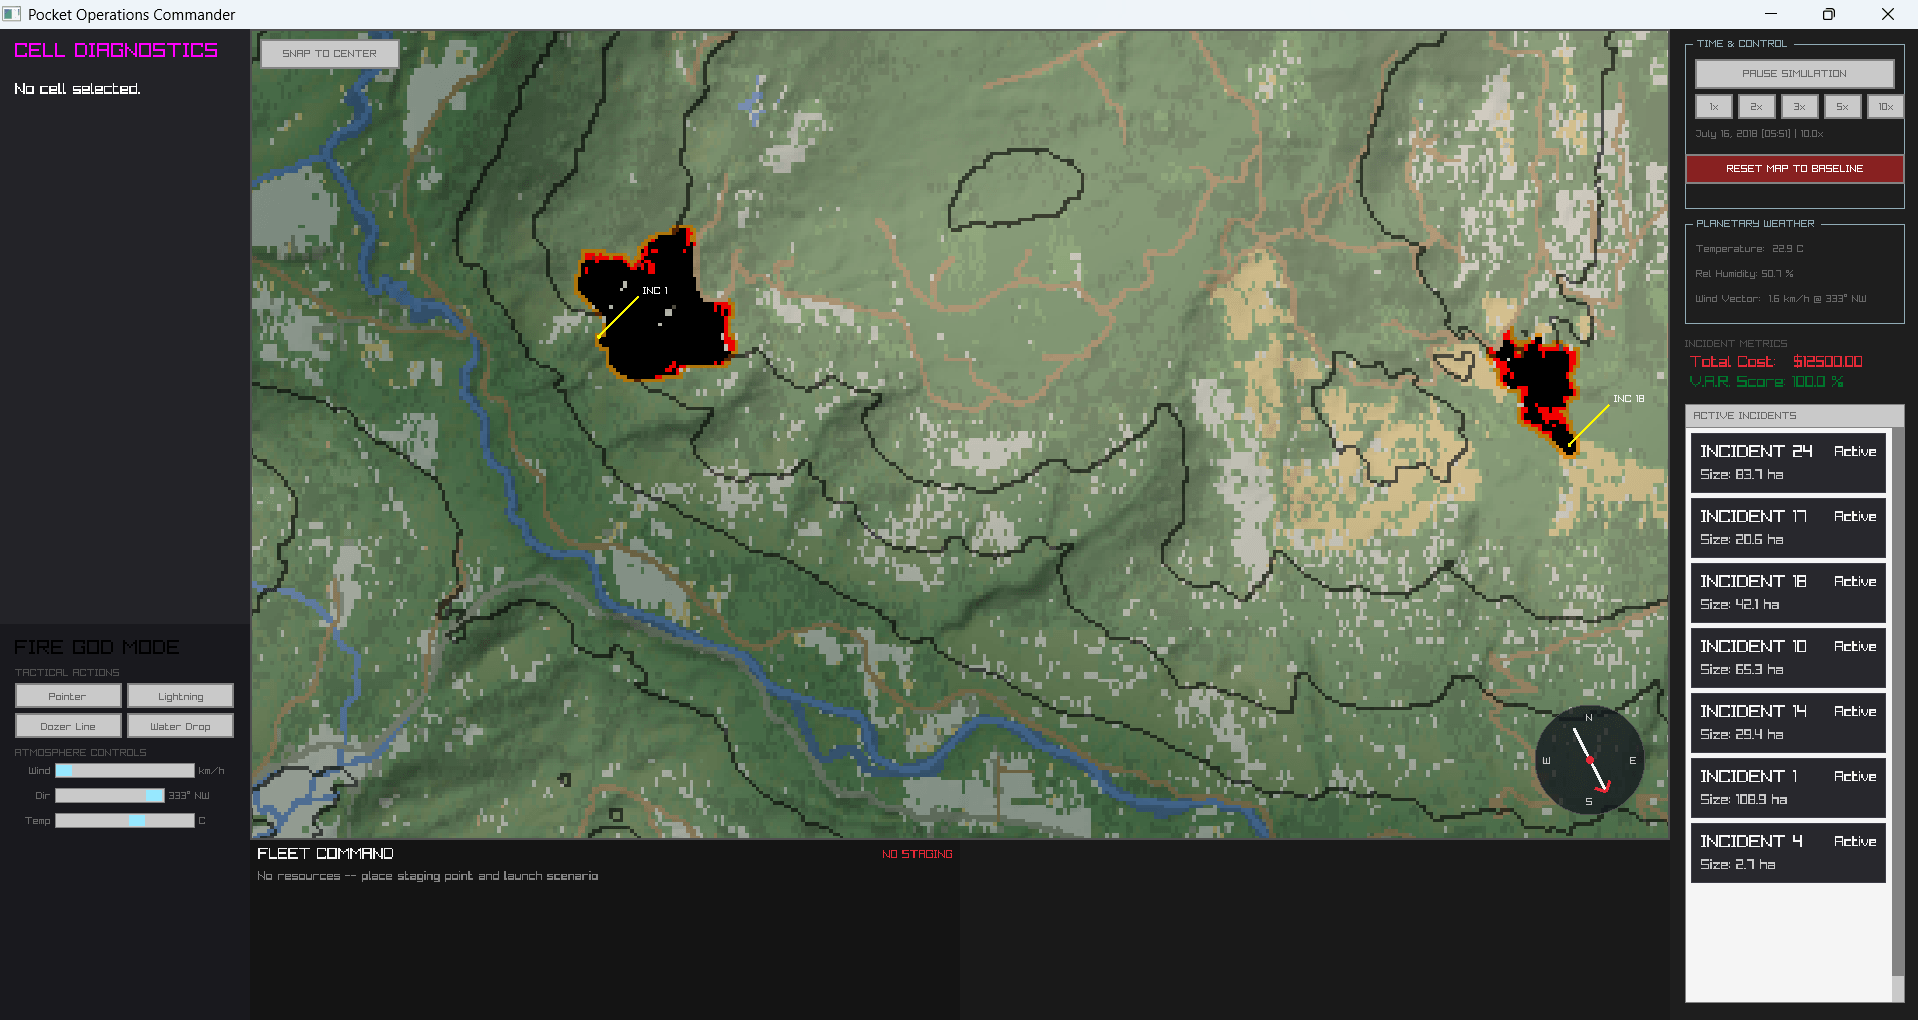

Trying to push radiant heat across grid cells at interactive rates forced me into the hardware — caches, layout, Structure of Arrays. IGNIS is fire behaviour and systems craft in the same frame.
Who it is for
Public understanding. Agency-adaptable training.
Most people never see the operational geometry of a wildfire. IGNIS aims to make that geometry visible without sanding off the consequences. For agencies, the same skeleton can grow into a training surface — physically grounded, performance-minded, honest about what the model can and cannot claim.
Python and Odin share the work: exploration where it helps, data-oriented paths where the frame budget is law. The project is still being built out — expect sharp edges and unfinished rooms.
Problem
Wildfire emergency management is invisible to the public, and agency training tools rarely capture the pressure of real operational decisions.
Approach
Cellular automata fire modelling with data-oriented design — Python and Odin respecting memory and frame time.
Outcome
An in-progress prototype with dual audience value: public understanding and a path toward agency training.
Technologies
- Python
- Odin
- Simulation
- Cellular Automata
- Fire Behaviour
- Data Oriented Design